
 Facebook
 X
X
 Pinterest
 Copy Link
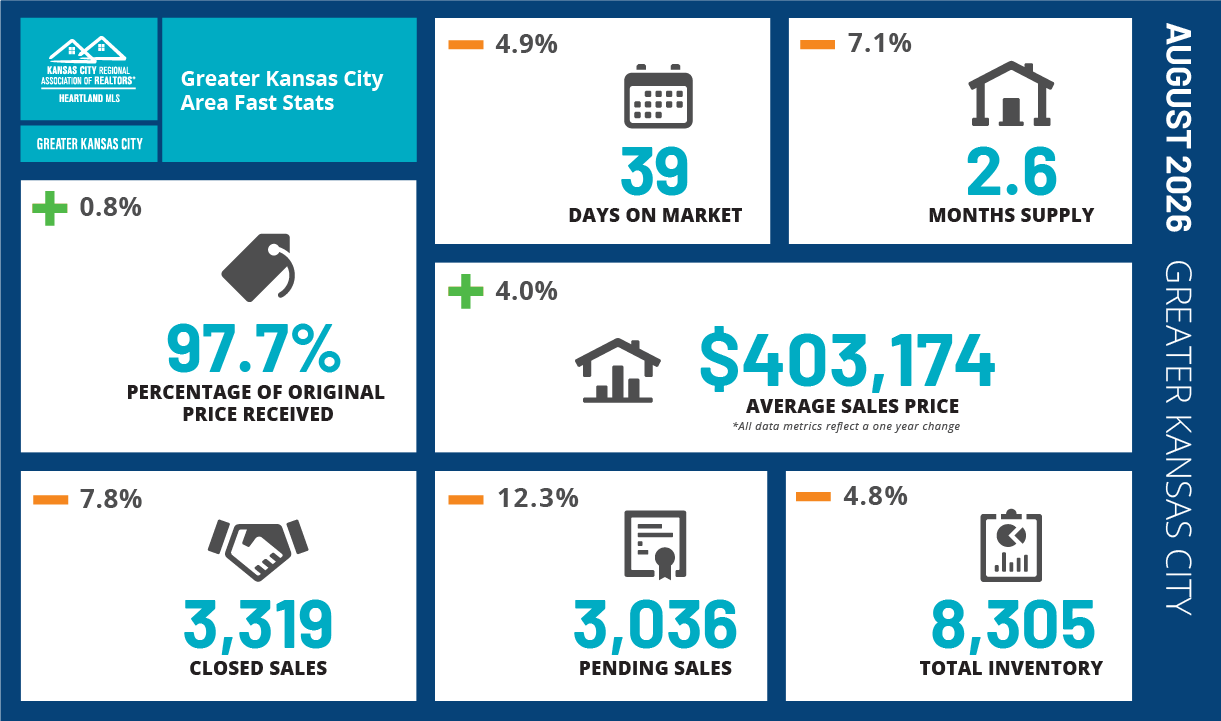
The Greater Kansas City housing market continues to show steady activity as we move toward fall. August brought changes in prices, inventory, pending sales and days on market, giving both buyers and sellers important information to consider.
Here’s a quick look at the latest numbers compared to August 2025:
📊 August 2026 Market at a Glance
💰 Average Sales Price: $403,174
⬆️ Up 4.0%
🏷️ Percentage of Original Price Received: 97.7%
⬆️ Up 0.8%
⏱️ Days on Market: 39 days
⬇️ Down 4.9%
🏠 Months Supply: 2.6 months
⬇️ Down 7.1%
🤝 Closed Sales: 3,319
⬇️ Down 7.8%
📝 Pending Sales: 3,036
⬇️ Down 12.3%
📈 Total Inventory: 8,305 homes
⬇️ Down 4.8%
🔎 What Does This Mean?
The August numbers show a market where home prices continue to rise while available inventory and the amount of time homes spend on the market have declined.
For sellers, the 4.0% increase in average sales price and 97.7% of original list price received are encouraging indicators. For buyers, the lower inventory and 2.6 months of supply mean competition can still exist for well-priced homes that stand out.
At the same time, the decline in closed and pending sales shows that buyers are continuing to be selective.
🏡 Thinking About Buying or Selling?
Whether you’re considering making a move now or simply want to understand what your home may be worth in today’s market, having current, local market information is essential.
The Kansas City real estate market continues to evolve—and the right strategy can make a difference.
📲 Have questions about the market or your home’s value? Let’s talk.
**All August 2026 data reflects a one-year change, as reported in the Greater Kansas City Area Fast Stats.**
