
 Facebook
 X
 Pinterest
 Copy Link
🔍 What’s Happening in the Greater Kansas City Housing Market?
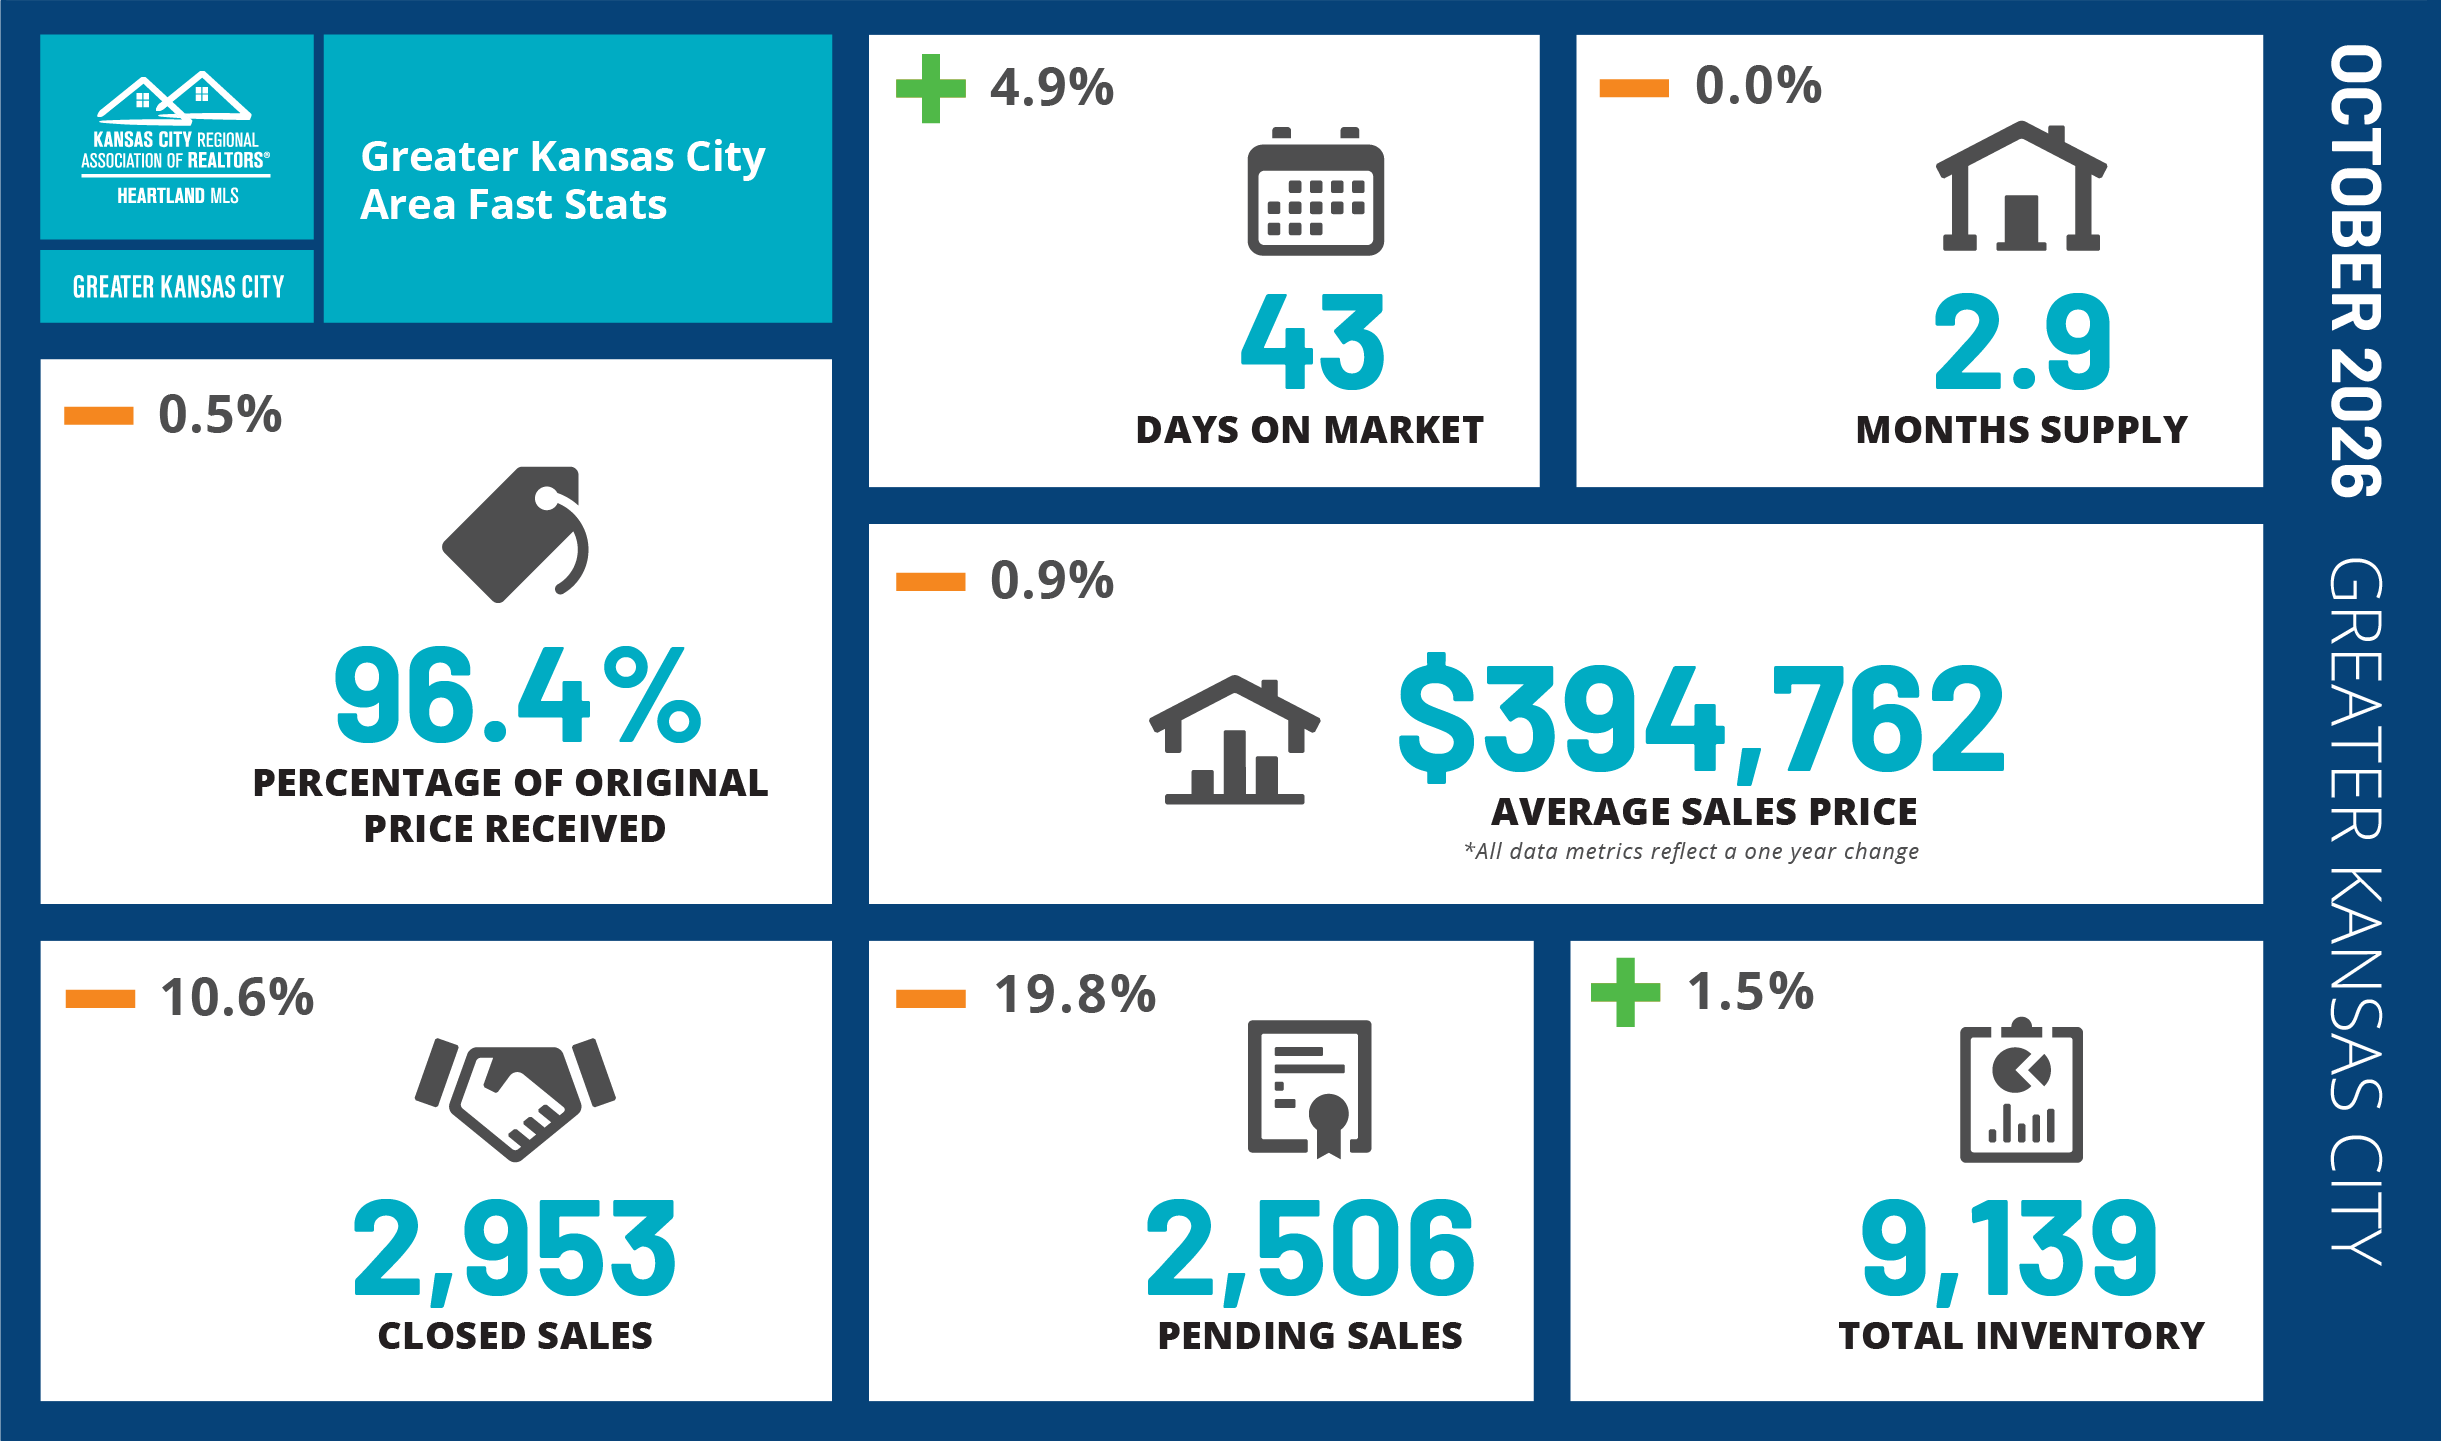
The Greater Kansas City housing market slowed in October 2026 compared with October 2025. Closed and pending sales both declined. The average sales price also dipped slightly. Meanwhile, available inventory increased, and homes took a little longer to sell. The average time on market reached 43 days.
Despite these changes, the supply of homes remained fairly tight at 2.9 months. That figure was unchanged from October 2025. However, buyers had slightly more homes to choose from, while sellers faced more competition.
There is another important detail to consider. The average sales price for October was down 0.9% from last year. However, the average price for January through October was up 3.5%. This gives us a better picture of the overall market.
Whether you’re buying, selling, investing, or watching your home’s value, these numbers are worth understanding. Here’s what the latest Heartland MLS report tells us about the local market.
📈 October 2026 Greater Kansas City Housing Market Highlights
Here are the latest numbers compared with October 2025:
- 🏡 Average Sales Price: $394,762 (down 0.9%)
- 📅 Days on Market: 43 days (up 4.9%)
- 🔑 Months of Supply: 2.9 months (unchanged)
- 🤝 Closed Sales: 2,953 (down 10.6%)
- 📝 Pending Sales: 2,506 (down 19.8%)
- 📊 Total Inventory: 9,139 homes (up 1.5%)
- 💰 Original List Price Received: 96.4% (down 0.5%)
All percentage changes above compare October 2026 with October 2025.
🔍 What Do These Numbers Mean for Buyers and Sellers?
The October numbers show fewer sales than a year ago. At the same time, more homes are available, and properties are taking longer to sell.
However, Greater Kansas City still has only 2.9 months of housing supply. Many housing reports use four to six months as a general guide for a balanced market. As a result, the area still has less inventory than that benchmark.
The market also varies from one community to another. Here is what the latest numbers may mean for you.
🏠 For Buyers
The drop in pending sales and small increase in inventory may create more opportunities for buyers.
For example, buyers may have more time to compare homes and explore different neighborhoods. They may also have more room to negotiate repairs or other terms.
However, well-priced homes can still attract strong interest. This is especially true in popular communities such as Shawnee, Lenexa, Olathe, and De Soto.
Before making an offer, look at recent sales and current competition. These details can help you decide what a home is worth and how much to offer.
💰 For Sellers
The average sales price fell just 0.9% from October 2025. Meanwhile, the year-to-date average sales price increased 3.5%.
Sellers also received an average of 96.4% of their original asking price. This shows why setting the right price from the start matters.
Today’s buyers pay close attention to price, condition, and overall value. Therefore, sellers should take time to prepare their homes before listing.
Homes that look great, show well, and have a fair asking price are better positioned to attract buyers.
On the other hand, an overpriced home may sit on the market longer. It may also need a price reduction later. Reviewing recent sales and competing homes can help sellers choose the right starting price.
📍 For Homeowners
Greater Kansas City statistics provide a useful look at the overall market. However, they don’t tell the whole story for every home.
Home values can vary based on location, size, age, condition, and recent sales nearby. Price range and property type also play an important role.
For homeowners in Shawnee, Lenexa, De Soto, Olathe, Spring Hill, and Western Johnson County, local sales data can provide a clearer picture.
A personalized comparative market analysis (CMA) is a good place to start. It looks at recent nearby sales, homes currently for sale, and the features of your property.
This can provide a better estimate of your home’s value than a metro-wide average or an online home-value estimate.
📍 Greg’s Local Market Perspective
One thing I’ve noticed when working with buyers throughout Shawnee and Western Johnson County is that many are taking more time before making offers than they did a few years ago.
Buyers are comparing homes more carefully and paying close attention to condition, updates, and overall value. As a result, homes that are priced correctly and prepared well continue to attract attention, while overpriced homes can sit on the market longer.
That’s why I encourage both buyers and sellers to focus on recent neighborhood sales and current competition rather than relying solely on broad regional market headlines.
📊 How Does October Compare to September?
It’s also helpful to look at how the market changed from one month to the next.
Here’s how October 2026 compared with September 2026:
| Market Statistic | September 2026 | October 2026 |
|---|---|---|
| Average Sales Price | $399,619 | $394,762 |
| Days on Market | 42 days | 43 days |
| Total Inventory | 8,832 | 9,139 |
| Months of Supply | 2.8 months | 2.9 months |
A few changes stand out:
- 💰 Average Sales Price: Decreased by $4,857 from September.
- 📅 Days on Market: Increased by one day.
- 🏘️ Total Inventory: Increased by 307 homes.
- 🔑 Months of Supply: Increased slightly from 2.8 to 2.9 months.
Overall, the market saw a small increase in available homes and time on market.
Keep in mind that monthly numbers can change for several reasons. Seasonal activity, the number of homes sold, and the types of homes on the market all play a role.
Therefore, one month’s change does not always point to a long-term trend.
For more details, read the September 2026 Greater Kansas City Real Estate Market Update.
📈 Year-to-Date Housing Market Trends
October’s average sales price was down 0.9% compared with October 2025. However, the year-to-date numbers tell a different story.
Through the first ten months of 2026, the average sales price increased 3.5%, while the median sales price increased 4.4%.
This broader view helps explain why one month’s statistics don’t necessarily indicate a decline in overall home values.
According to the October 2026 Heartland MLS Local Market Update, here are the additional year-to-date numbers compared with the same period in 2025:
- 🏡 Year-to-Date Average Sales Price: $395,969 (up 3.5%)
- 💰 Year-to-Date Median Sales Price: $335,000 (up 4.4%)
- 🤝 Year-to-Date Closed Sales: 32,237 (up 1.3%)
- 📊 Year-to-Date Original List Price Received: 97.6% (down 0.1%)
For buyers, sellers, and homeowners, these figures provide a more complete picture of the Greater Kansas City housing market.
🔮 What’s Next for the Kansas City Real Estate Market?
As we move through the final months of 2026, seasonal changes will continue to affect the housing market.
Here are a few things worth watching:
- 🏘️ Inventory Trends: Will the number of available homes continue to rise, or will inventory begin to decline?
- 📅 Seasonal Activity: How will buyer demand and new listings change as the year comes to a close?
- 💵 Mortgage Interest Rates: How will borrowing costs affect monthly payments and buying power?
- 🏡 Housing Affordability: How will home prices, interest rates, taxes, and insurance affect buyers’ budgets?
These factors will continue to shape the Greater Kansas City housing market.
While no one can predict exactly what comes next, buyers and sellers can benefit from watching local market activity.
Rather than relying only on national headlines, I recommend paying attention to what is happening in the communities and price ranges that matter most to you.
📍 Featured Community Snapshot: Shawnee, Kansas
Each month, I’ll feature a different community throughout Shawnee and Western Johnson County. This is a chance to share more about local neighborhoods, housing options, and the area.
This month’s featured community is Shawnee, Kansas.
Located in Johnson County, Shawnee offers a wide range of homes. Buyers can find established neighborhoods with mature trees, along with newer homes and developments.
The city also offers parks, recreation, shopping, restaurants, and easy access to major roads. These connections make it convenient to reach Lenexa, Olathe, De Soto, Overland Park, and the greater Kansas City area.
For buyers, it’s important to remember that not all areas of Shawnee are the same. Home prices, property features, and neighborhood settings can vary across the city.
For homeowners, recent nearby sales can help show how their property compares with other homes in the area.
Looking for more information about homes, neighborhoods, schools, and local real estate trends in Shawnee? Visit my comprehensive Shawnee Real Estate FAQ and Community Guide below.
👉 Explore the Shawnee, KS Real Estate FAQ and Community Guide
Next month’s featured community will be Lenexa, Kansas.
🏡 Thinking About Buying or Selling?
Whether you’re thinking about buying or selling, having good local information matters.
Are you considering a move to Shawnee, Lenexa, De Soto, Olathe, Spring Hill, or another Western Johnson County community? I’d be happy to help you understand the local market.
For sellers, I can provide a personalized market analysis. This includes recent sales, competing homes, and current buyer activity in your neighborhood.
For buyers, I can help you compare homes, develop an offer strategy, and work through negotiations.
Since 2004, I’ve helped buyers and sellers throughout Kansas and Missouri, with more than 548 homes sold over my career. As a solo agent, I work directly with every client from the first conversation through closing, providing personalized attention, straightforward advice, and responsive guidance throughout the process.
📲 Contact Greg Weis for a personalized market update or home value analysis.
Let’s talk about your real estate goals and what the current market means for your next move!
Greg Weis, REALTOR®
Coldwell Banker Regan Realtors
Website: www.gregweis.com
Email: gweis@cbregan.com
📊 Market Data Source
Heartland MLS Greater Kansas City Area Fast Stats – October 2026.
Additional year-to-date statistics are from the Kansas City Regional Association of REALTORS® and Heartland MLS October 2026 Local Market Update.
View the October 2026 Heartland MLS Local Market Update
All monthly percentage changes compare October 2026 with October 2025. Year-to-date comparisons cover January through October 2026 versus the same period in 2025.
Average and median sales prices do not account for sale concessions or down payment assistance. These regional statistics are for information only. They should not be used to determine the value of an individual property.
🔗 Related Market Updates & Local Real Estate Resources
Recent Greater Kansas City Market Updates
- 🏡 Greater Kansas City Real Estate Market Update – September 2026
- 📊 Kansas City Real Estate Market Update – Q3 2026
Local Community & Real Estate Guides
